At PROCAS, it is our mission to improve the quality of life of our clients by simplifying government contract accounting. In order to accomplish this, we believe that we should provide the best solution of presenting meaningful data to our clients in the most efficient way possible. Because what good is having a DCAA compliant accounting system if it is a hassle to get data out of it?
The PROCAS Accounting Dashboard helps you manage your business with an easy to read snap shot of your company’s real-time financial data, with no additional setup or configuration required.
The below video and post is broken into 7 Sections:
- Cash
- Accounts Receivable
- Accounts Payable
- Income Statement
- Balance Sheet
- Financial Ratios
- Dashboard Default Controls & Troubleshooting
To access the dashboard, please go to Accounting –> Dashboard –> Accounting Dashboard in the menus.
Cash
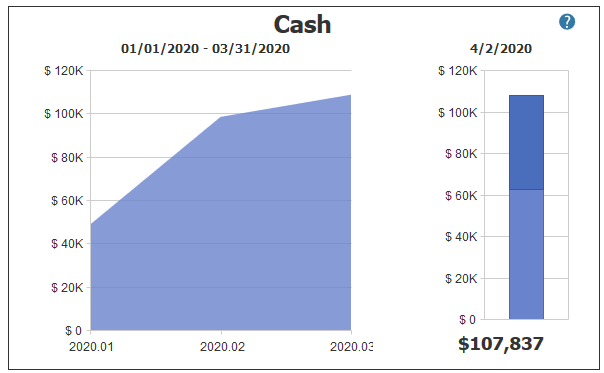
Getting ready to process payroll? Pay vendor invoices? Deposit a client payment? This tile will give you an accurate balance of how much cash is on hand.
Graph 1 – Cash Flow over a Period of Time
- Default Date Range – Current Year Beginning Period to Current Period
- Range can be modified using slider bar control defined under Income Statement section
- Tool Tips – Hovering over each month with mouse in the area graph will give accurate cash balance ending each period
- Color – Dark Blue (Indigo) = Assets
- Report – Selecting “Cash” title at the top will generate Statement of Cash Flows for date range
- Report has full drill through capabilities to Account, Vendor/Client, & Transaction level details
Graph 2 – Cash Balance as of Today’s Date
- Default Date – Date & Time Dashboard is generated (Today)
- Tool Tips – Hovering over each cash account (displayed by different shade of dark blue) will provide accurate balance as of today
- Colors – Shades of Dark Blue (Indigo) = Assets
Accounts Receivable
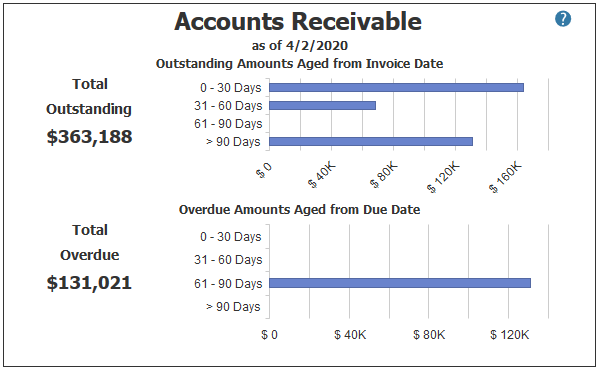
Manage your cash flow by staying on top of what’s owed to your organization. This tile will show you how many client payments still need to be collected and how long they’ve been outstanding.
Graph 1 – Outstanding Amounts Aged from Invoice Date
- Default Date – Date & Time Dashboard is generated (Today)
- Range – 30 day bars sorted by invoice date
- Invoice date is stored on the sales journal where the revenue and receivable are recorded
- Tool Tips – Hovering over each bar will give accurate receivable total for specified time frame
- Color – Dark Blue (Indigo) = Assets
- Report – Selecting “Accounts Receivable” title at the top or “Total Outstanding” on the side will generate Accounts Receivable report for today’s date
- Report defaults to transaction level detail to be able to see all transactions that make up the totals
Graph 2 – Overdue Amounts Aged from Due Date
- Default Date – Date & Time Dashboard is generated (Today)
- Range – 30 day bars sorted by due date
- Due date is established on the client record under “Payment Terms”
- Tool Tips – Hovering over each bar will give accurate receivable total for specified time frame
- Color – Dark Blue (Indigo) = Assets
- Report – Selecting “Total Overdue” on the side will generate Accounts Receivable report for today’s date
- Report defaults to transaction level detail to be able to see all transactions that make up the totals
Accounts Payable
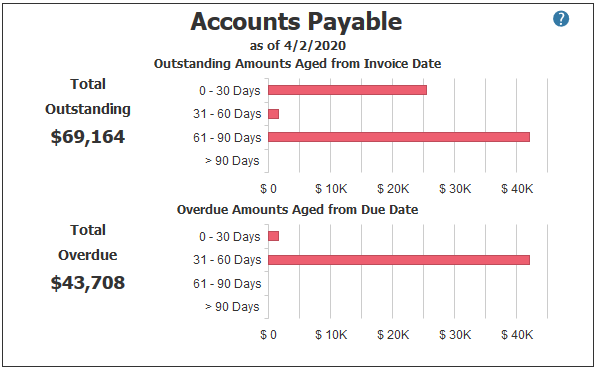
Don’t get behind on bills owed to your vendors. This tile will show you how many invoices still need to be paid and how long they’ve been outstanding.
Graph 1 – Outstanding Amounts Aged from Invoice Date
- Default Date – Date & Time Dashboard is generated (Today)
- Range – 30 day bars sorted by invoice date
- Invoice date is stored on the purchases journal where the expense and liability are recorded
- Tool Tips – Hovering over each bar will give accurate payable total for specified time frame
- Color – Red = Liabilities
- Report – Selecting “Accounts Payable” title at the top or “Total Outstanding” on the side will generate Accounts Payable report for today’s date
- Report defaults to transaction level detail to be able to see all transactions that make up the totals
Graph 2 – Overdue Amounts Aged from Due Date
- Default Date – Date & Time Dashboard is generated (Today)
- Range – 30 day bars sorted by due date
- Due date is established on the vendor record under “Payment Terms”
- Tool Tips – Hovering over each bar will give accurate payable total for specified time frame
- Color – Red = Liabilities
- Report – Selecting “Total Overdue” on the side will generate Accounts Payable report for today’s date
- Report defaults to transaction level detail to be able to see all transactions that make up the totals
Income Statement
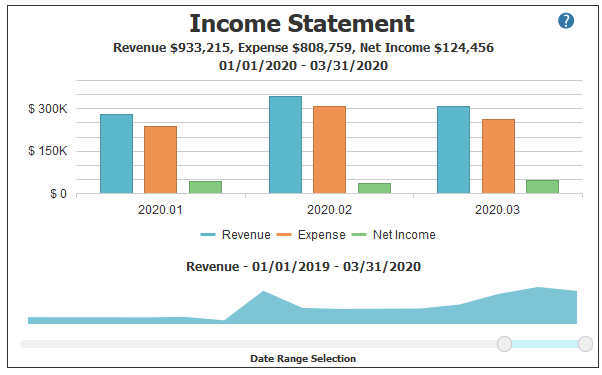
Use the Income Statement graph to monitor the overall profitability performance of your company. This tile breaks down your organization’s revenue, expenses, and net income over a period of time.
Graph 1 – Income Statement
- Default Date Range – Current Year Beginning Period to Current Period
- Range can be modified using slider bar control below
- Tool Tips – Hovering over each income statement item will give accurate balances as of end date of period range
- Color – Light Blue = Revenue, Orange = Expenses, Green = Net Income
- Legend – Clicking Revenue, Expenses, and/or Net Income will remove or add each bar to the graph
- Report – Selecting “Income Statement” title at the top will generate Income Statement as of end date of period range
- Report has full drill through capabilities to Account, Vendor/Client, & Transaction level details
Graph 2 – Revenue Area Graph
- Default Date Range – Inception-to-Date Period to Current Period
- Tool Tips – Hovering over each period will give accurate revenue numbers as of end date of period
- Color – Light Blue = Revenue
Dashboard Date Range Selection – Slider Bar
- Beginning Period – Slide first button left or right to change the beginning date period
- First possible period = Inception-to-Date Period
- Tiles Updated when Modified – Total Cash by Month, Income Statement, Bottom 3 Financial Ratios
- Ending Period – Slide the second button left or right to change the ending date period
- Last possible period = Current Period
- Tiles Updated when Modified – Total Cash by Month, Income Statement, Balance Sheet, Top 3 Financial Ratios
Balance Sheet
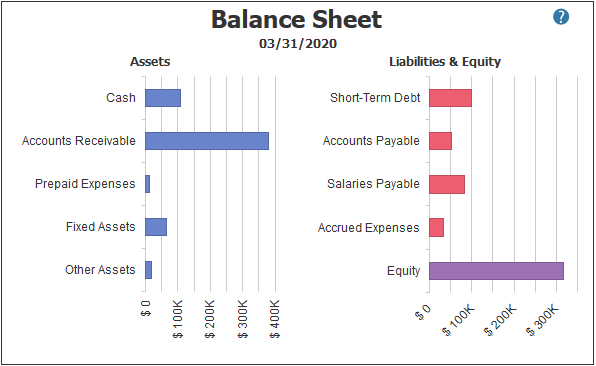
Use the Balance Sheet graph to quickly see the distribution of your company’s resources and obligations. This tile breaks down your organization’s assets, liabilities, and owner’s equity.
Graph 1 – Balance Sheet
- Default Date Range – Current Year Beginning Period to Current Period
- Range can be modified using slider bar control defined under Income Statement section
- Tool Tips – Hovering over each balance sheet item will give accurate balances as of end date of period range
- Color – Dark Blue (Indigo) = Assets, Red = Liabilities, Purple = Owner’s Equity
- Report – Selecting “Balance Sheet” title at the top will generate Balance Sheet as of end date of period range
- Report has full drill through capabilities to Account, Vendor/Client, & Transaction level details
Financial Ratios
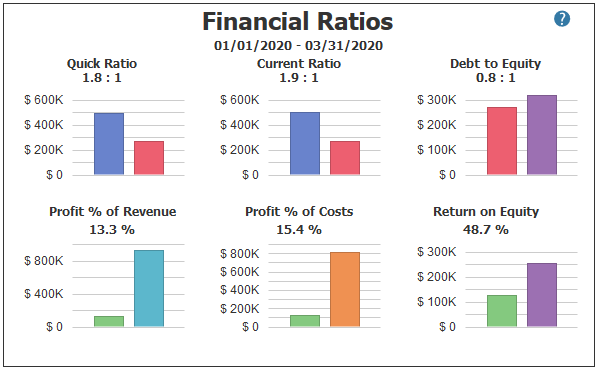
Key Performance Indicators are right here at a glance to help you gauge your company’s liquidity, profit margins, and growth in earnings. What is considered “Good” varies by industry and company, but some definitions and common suggestions for interpreting the ratios are provided here:
Ratio 1 – Quick Ratio
- Formula – Quick Assets divided by Current Liabilities as of the selected end date
- Colors – Dark Blue (Indigo) = Assets, Red = Liabilities
- Defined – Quick Assets are defined as Cash, Marketable Securities and Accounts Receivable
- Interpretation – A Quick Ratio should generally be ≥ 1:1
- Lower ratios may indicate that the company does not have enough short-term assets to cover its short-term liabilities.
Ratio 2 – Current Ratio
- Formula – Current Assets divided by Current Liabilities as of the selected end date
- Colors – Dark Blue (Indigo) = Assets, Red = Liabilities
- Interpretation – A Current Ratio should generally be ≥ 1:1 and ≤ 3:1
- Lower ratios may indicate that the company does not have enough short-term assets to cover its short-term liabilities.
- Higher ratios may indicate that assets are not being used efficiently.
Ratio 3 – Debt to Equity
- Formula – Total Debt divided by Total Owner’s Equity as of the selected end date
- Colors – Red = Liabilities, Purple = Owner’s Equity
- Interpretation – A Debt to Equity Ratio should generally be ≤1.5:1
- Higher ratios may indicate that a company is too highly leveraged with debt and may not be able to generate enough cash to satisfy its debt obligations.
Ratio 4 – Profit % of Revenue
- Formula – Net Income divided by Revenue for the selected date range
- Colors – Green = Net Income, Light Blue = Revenue
- Interpretation – Profit % of Revenue should generally be between 4% – 25%, depending on contract type(s) and the business model.
Ratio 5 – Profit % of Costs
- Formula – Net Income divided by Expenses for the selected date range
- Colors – Green = Net Income, Orange = Expenses
- Interpretation – Profit % of Costs should generally be between 4% – 33%, depending on contract type(s) and the business model.
Ratio 6 – Return on Equity
- Formula – Net Income for the period divided by Average Equity for the selected date range
- Colors – Green = Net Income, Purple = Owner’s Equity
- Defined – Average Equity is defined as the sum of beginning and ending equity divided by 2.
- Interpretation – A Return on Equity Ratio should generally be ≥ 14% per year (the long-term average of the S&P 500).
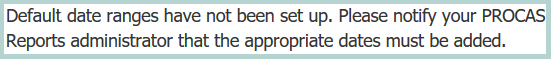
Dashboard Default Controls & Troubleshooting
This item is included because it must be completed to have the dashboard populate. If you do not complete this screen, it is possible you will see the following error when clicking on the dashboard:
To access the default screens for the dashboard, please navigate to the following:
Accounting –> Dashboards–> Report Defaults – (should be located right below the Accounting Dashboard)
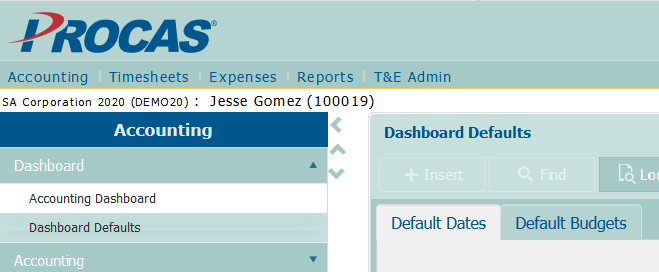
In this menu, update the following 6 default fields to populate relevant data within a matter of seconds on the dashboard:
General
1. ![]()
- Established one time – beginning date for slider bar under the income statement.
2. ![]()
- Updated once a month – used for reference/informative purposes.
- Should be updated each time an accounting period is closed.
Reporting Period
3. ![]()
- Updated once a month – prior year period to compare to current year period.
4. ![]()
- Updated once a month – current year accounting period for reporting purposes.
- Ending date for the slider bar under the income statement.
- Should typically be the period after the “Books Good Through Date.”
Reporting Year
5. ![]()
- Established once a year – prior accounting year for reporting purposes.
6. ![]()
- Established once a year – current accounting year for reporting purposes.
Help & Explanations – 
- For more details on establishing any of the 6 defaults, please click the help icon in the upper right hand corner of the menu.
- The help icon can also be selected on the Accounting Dashboard for more explanations on how the tiles are calculated.
For any additional help utilizing the dashboard, please reach out to your PROCAS Consultant.
As always, operating DCAA compliant accounting software not only incorporates the software itself, but how it is used. Please be sure to check with your administrative staff for an explanation of how your policies and procedures align with our government contract accounting system.